BOA Release (3 Feb 2021)
Introduction#
Over the past 80 years Contact Center (CC) has become an isolated industry with its own management practice and ethics. As such, CC’s are widely used in any “market verticals” to handle various kinds of customer interactions from sales to service.
One aspect that is common to all CC’s is that they handle a large number of calls. The volumes are so high that CC’s have trained staff that is solely dedicated to handle those calls. Therefore, any CC is notoriously expensive to run.
There are two main KPIs that CC managers strive to ‘optimize’: Customer Satisfaction (CSAT) and Handling Times (HT). Ultimately, Customer Satisfaction depends on the waiting times (they should be as short as possible) as well as the ability of the CC to address customer enquiries efficiently. Handling Time is a KPI which counts the duration of each call between Customer and Agent. The longer the Average HT, the more agents a CC would need to keep the CSAT levels high. Therefore, it is a form of art to ensure high CSAT whilst keeping Average HT low.
Tranditionally, system vendors who provide CC functionality calculate a breadth of KPIs which allow CC managers to guage CSAT at any point in time such as Waiting Times, Number of Calls Waiting and agent acivity (e.g. idle, break, on call, offline, on training etc…). However, there is limited visibility on what actually happens during the call between customer and agent.
Omni Intelligence have developed an accurate, AI-based, language independent method of call analysis which provides Back Office Activity KPIs for calls between customer and agent. The developed system has been designed specifically for telephony call recordings sampled at 8000 Hz and shows high accuracy (99.95%) on the tested languages.
A modern CC heavily relies on the IT infrastructure of the company (Back Office). Thereofore, poorly designed business processes, lack of agent training and/or deficiencies in the IT sub-system performance result in prolonged Back Office Activity (BOA) times (time agent spends interacting with the Back Office system while handling a customer call) that can range anywhere between 5%-70% of the total call duration. The ability to accuratly measure BOA is a useful tool to help CC managers understand their Average Handling Times. It provides immediate visibility on how much time agents spend on querying information / data entry. It is also a reliable gauge to measure the impact of agent training / business process & IT optimization.
How It Works#
To report on BOA, Omni Intelligence will subscribe to your CC to receive call recordings. The AI sub-system responsible for Speech Analytics then ‘listens’ on each of the recording automatically and marks the parts where the agent had to interact with the Back Office system - including Hold Times - for data look up or entry.
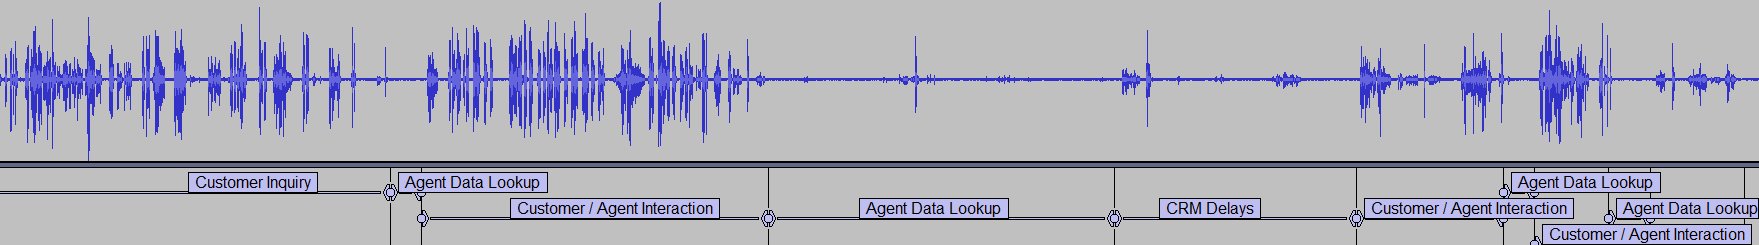
Once the analysis is complete, the AI will summarize the measurements to produce the total BOA duration for the call and save this information as follows:
• Time of call• Handling time• BOA time• Agent information (ID)• Queue information (ID)• Wrap-up codeEach call of your CC that is analysed by the Omni Intelligence AI sub-system will have a record in the database. In addition, the following KPIs will be calculated on the historical data:
Baseline BOA#
Baseline is the Best Average BOA over the past 30 days calculated for each queue. Therefore, it is a measure of the efficiency of your Business Processes and IT infrastructure itself.
The high values of Baseline BOA mean that Agent training will be ineffective in reducing Average Handling Times for the queue in question and Business Processes would need to be optimized to achieve further reductions in AHT.
The Baseline BOA is also a Gold Standard that your agents should be aspiring to.
Training Performance Gain#
The performance gain is a percentage of Handling Time that can be realistically eliminated if Agents are trained further. It is the average BOA for all your staff (per queue) offset by the Baseline BOA.
Mean BOA#
Finally, the Mean BOA can be used to group agents based on their efficiency levels. Those who are listed above the Mean BOA would benefit from further training more than the top performers listed below Mean BOA.
Understanding your Speech Analytics Reports#
Agent BOA Report#
The report lists all agents grouped by queues and provides details on each agent individually for the report period. The following fields are available for selection:
• Avg. After Interaction Work Time• Avg. Handling Time• Avg. Queue Wait Time• Avg. Talk Time• Avg. Hold Time• Avg. BOA Time• Avg. BOA (Per cent)• Baseline BOA (Per cent)• Mean BOA (Per cent)• TotalsThe sort order of agents is from Highest BOA to Lowest BOA.
Call-by-Call BOA Report#
The report lists all calls analysed by the Omni Intelligence AI sub-system. The following fields are available:
• Interaction ID (Call ID)• Timestamp• Handling Time• BOA Time• BOA Percent• Agent• Queue• Wrap-up Code• TotalsNote: If a call was transferred from Agent to Agent and/or from Queue to Queue, multiple records will be stored in the Call BOA Report - one per conversational segment. In this case:
| Field | Interpretation |
|---|---|
| Interaction ID | will be the same for all conversational segments of the call |
| Timestamp | the start time of call handling |
| Handling Time | the total handling time of the conversational segment |
| BOA Time | calculated for the conversational segment |
| Wrap-up Code | will be the same for all conversational segments of the call |
BOA By Queue Report#
This is a summary report which provides BOA summary for each queue over the reporting period. The report is sorted from Highest to Lowest BOA. The following fields are available:
• Queue• Total BOA Time• Total BOA (Per cent)• Baseline BOA (Per cent)• Mean BOA (Per cent)• Avg. / Total Handling Time• Avg. / Total Hold Time• Avg. / Total Wait Time• Avg. / Total After Interaction Work Time• Total Interactions AnsweredBOA By Wrap-up Report#
This is a summary report which provides BOA summary for each Wrap-up code for the reporting period. The report is sorted from Highest to Lowest BOA. The following fields are available:
• Wrap-up Code• Total BOA Time• Total BOA (Percent)• Baseline BOA (Percent)• Mean BOA (Percent)• Avg. / Total Handling Time• Avg. / Total Hold Time• Avg. / Total Wait Time• Avg. / Total After Interaction Work Time• Total Interactions AnsweredNote: if no Wrap-up code is submitted, the Wrap-up Code field will contain “N/A” (not available).
Real-time Features and Gamification#
In addition to Historical Reporting, Omni Intelligence provides the following Real-Time metrics which can be displayed on a Wallboard updated live.
Real-time Fields:
| Field | Description |
|---|---|
| BOA | aggregated for ‘Today’ (available for each Queue, expressed in per cent units) |
| BOA Time | aggregated for ‘Today’ (available for each Queue, expressed in HHH:mm:ss) |
| Mean BOA | aggregated for the past 30 days (available for each Queue, expressed in per cent units) |
| Baseline BOA | aggregated for the past 30 days (available for each Queue, expressed in per cent units) |
Supervisor Extended:
• Each Agent tile has ‘BOA’ – aggregated for ‘Today’, expressed in per cent units• Speech Analytics sort option is available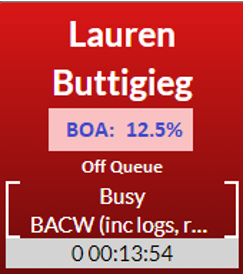
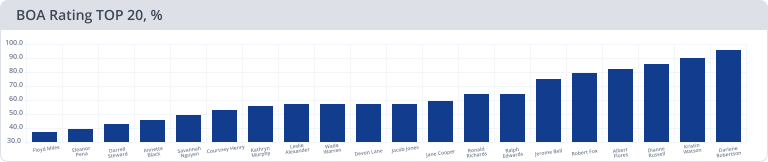
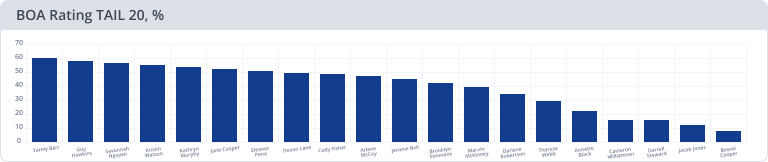
Real-time Widgets:
A new Speech Analytics widget is added to the real-time reporting. The Widget itself is a Bar Graph that allows to show groups of Agents / Wrap-up codes based on their Speech Analytics scores (e.g., ‘Top N’ agents) for the Supervisors to manage BOA during their shift.